
The Best Parameter Is Often the Wrong Answer: Why Robust Ranges Matter More Than a Single Optimum
Optimization can find the setting that won the past. Robustness testing asks a harder question: whether the strategy still works when the setting, period, costs, or market regime changes.
Anuj Saxena · Founder, TradingEdgeIQ
Third in a series on structured trading research. Start with From Trading Idea to Trading Decision, then read The Backtest Is Not the Strategy, which examined five ways a profitable result can still be fragile. This article goes deeper into one of them: parameter selection.
The best historical parameter is often not the best parameter to trade.
Optimization gives a precise answer to a narrow question: which tested configuration produced the highest value of a chosen metric over a particular historical period?
That answer can be mathematically correct and still be the wrong basis for a trading decision.
The problem is not optimization itself. Testing different lookbacks, thresholds, stops, targets, filters, and position-sizing rules is a legitimate part of strategy research. The problem begins when the winning configuration is treated as though history has revealed a natural constant:
The 37-day lookback was best, therefore 37 is the right answer.
History rarely supports that much precision.
A more defensible result usually looks less like a single summit and more like a broad plateau: a region where neighboring parameter choices remain useful, the strategy's behavior changes gradually, and no one exact setting carries the entire claim.
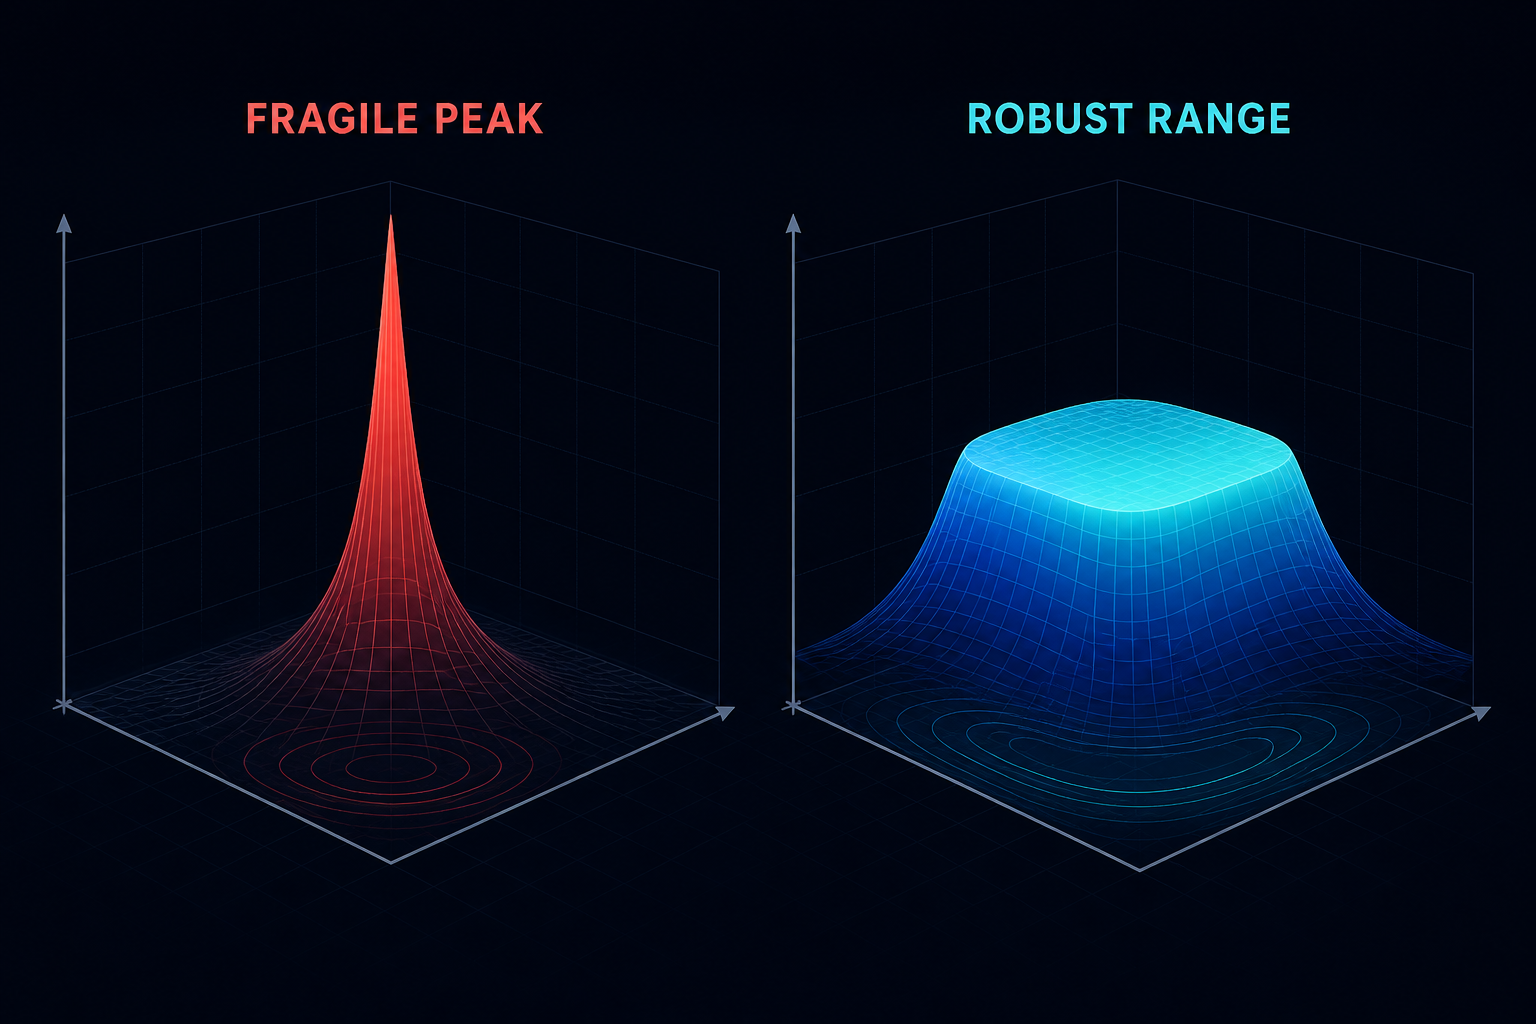
A peak identifies the historical winner. A plateau shows whether nearby choices support the same underlying idea. Neither predicts the unknown future surface; the plateau simply demands less precision from it.
This leads to the central recommendation:
Use optimization to find robust regions worth validating, not to crown a historical winner.
That shift sounds modest. In practice, it changes what gets measured, what gets rejected, and what a trader is entitled to conclude.
The situation: every strategy contains choices
Even a simple trading rule contains parameters.
A moving-average strategy needs lookback lengths. A breakout strategy needs a window and perhaps a confirmation threshold. A mean-reversion strategy needs an entry level, exit level, and holding constraint. Risk management adds stops, targets, sizing rules, exposure limits, and possibly volatility adjustments.
Suppose a strategy has only four adjustable inputs, and you test ten values for each. That produces:
10 × 10 × 10 × 10 = 10,000 configurations
One of them must finish first.
The existence of a winner does not establish the existence of an edge. It establishes only that a ranking was performed.
This distinction is easy to overlook because optimization software makes the output look authoritative. The leading row may report a precise net profit, Sharpe ratio, drawdown, win rate, and parameter combination. Precision in the display can create confidence in the conclusion.
But the optimizer has not yet answered the question that matters:
Did this configuration win because it captured repeatable structure, or because it matched the accidents of this particular historical sample?
The complication: optimization selects noise as efficiently as it selects structure
Financial history contains both signal and noise. An optimizer cannot tell the difference merely by maximizing an outcome.
If one configuration happens to align with several favorable trades (entering just early enough, avoiding one loss, or placing a stop just outside a historical reversal), it can rise above its neighbors dramatically. The optimizer has done its job. It found the combination that best exploited the sample it was given.
The trouble is that some of those historical details will not repeat.
Halbert White formalized a practical test for data snooping: once the same historical record is repeatedly used for inference and model selection, satisfactory results may arise by chance rather than from genuine predictive merit. Bailey, Borwein, López de Prado, and Zhu later developed a framework for estimating the probability that the strategy selected from a backtest competition is overfit, and therefore likely to underperform out of sample.
The more configurations you test, the more opportunities there are to discover a lucky one.
That does not mean broad search is forbidden. It means the winning result must carry the burden of the search that produced it. A Sharpe ratio selected from 10,000 trials does not deserve the same interpretation as the identical Sharpe ratio from one pre-specified test. The Deflated Sharpe Ratio addresses this directly by adjusting the observed Sharpe ratio for selection bias, the number of trials, and non-normal returns.
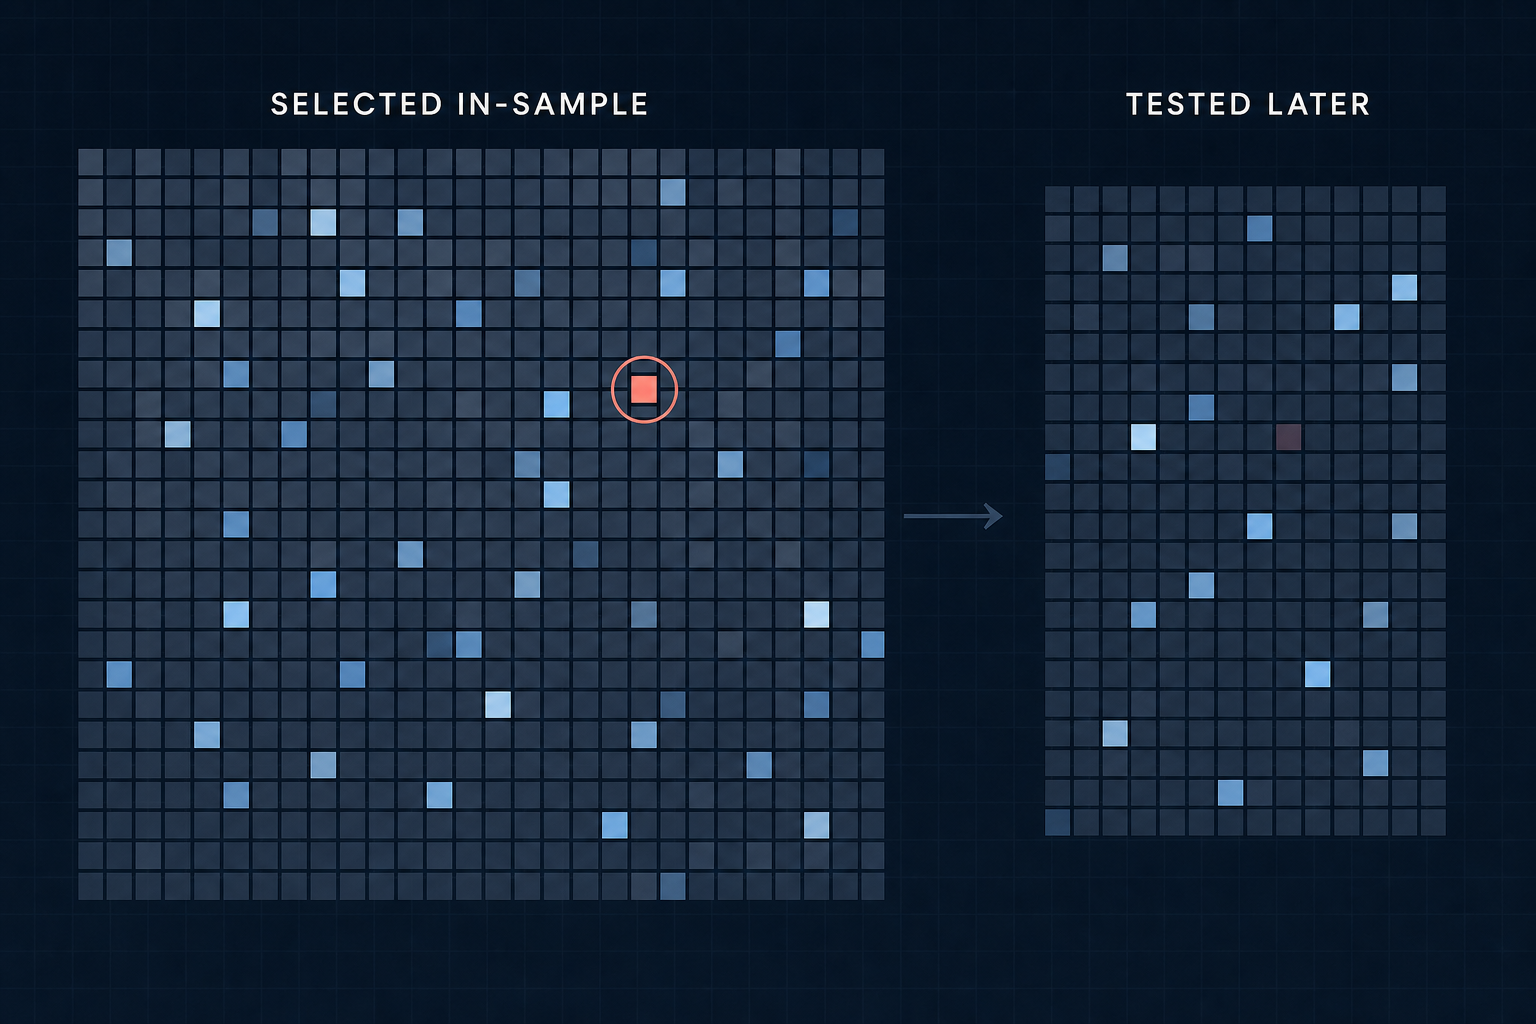
When thousands of configurations compete, one must finish first. Change the sample and the brightest cell can move.
The question: what would a robust result look like?
If the single highest result is not enough, what should replace it?
Not another magic statistic.
Robustness is a body of evidence. It asks whether the strategy remains useful when reasonable features of the test change:
- the parameter is nudged;
- another objective is considered;
- execution costs increase;
- the period moves forward;
- the market regime changes;
- the instrument changes; or
- the sequence of returns becomes less favorable.
The most useful place to begin is the shape of the parameter surface.
Read the surface, not only the winner
An optimization table ranks configurations. A parameter surface reveals the relationship among them.
Imagine testing a moving-average lookback from 10 to 80 days.
In the first result, performance is unremarkable almost everywhere, except at 37 days, where it spikes. At 36 and 38 days, the result deteriorates sharply.
In the second, lookbacks from 31 to 46 days all produce reasonably similar results. The best happens to be 39, but 37, 41, and 44 remain competitive.
Both tests may report the same maximum profit. They do not contain the same evidence.
The isolated peak says:
This precise setting matched this precise history.
The plateau says:
The underlying logic appears to tolerate imprecision.
That tolerance matters because live trading is full of imprecision. Orders fill differently. Volatility changes. A signal arrives one bar later. Costs drift. Relationships that were stable become weaker. If the strategy requires a historically perfect setting, ordinary variation can remove the result.
What to examine around the optimum
For each leading configuration, ask:
- How quickly does performance decay nearby? Gentle degradation is generally more reassuring than collapse.
- How large is the stable neighborhood? Three adjacent values are weaker evidence than a broad region spanning materially different choices.
- Does the neighborhood remain stable across more than one metric? A profit plateau may conceal a drawdown cliff.
- Does the region survive costs and later data? In-sample smoothness alone is not validation.
- Does the location of the plateau make economic sense? A stable pattern without a plausible mechanism may still be accidental.
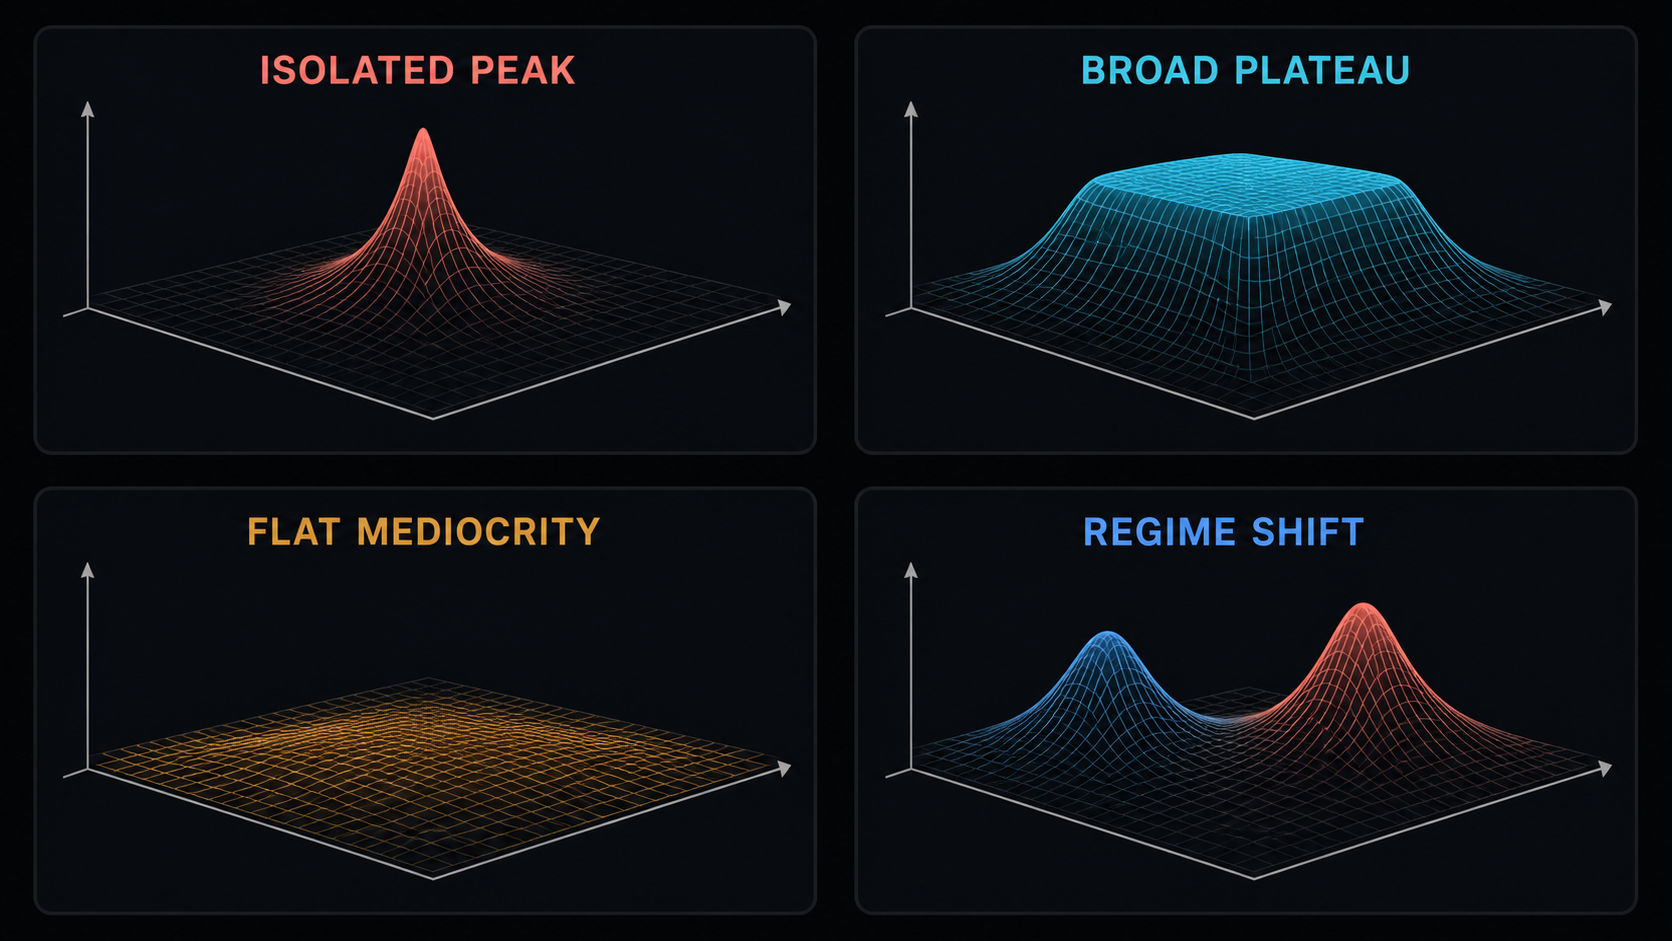
Four broad diagnostic outcomes: an isolated peak, a broad plateau, flat mediocrity, and a regime-dependent shift. Smoothness alone is not evidence of a useful edge.
The objective function chooses the answer
There is no best parameter independent of the metric used to define “best.”
Maximize total return and the optimizer may favor leverage, concentration, and large drawdowns. Maximize win rate and it may prefer frequent small gains with rare severe losses. Minimize drawdown and it may select a strategy that barely participates. Maximize Sharpe ratio and the answer may change with sampling frequency, return distribution, or a small number of outliers.
The optimizer does not know what outcome you actually need. It follows the objective it was given.
Consider two hypothetical configurations. All figures below are illustrative, not live strategy results or expected performance. Both configurations assume the same starting capital and the same evaluation periods:
| Measure | Configuration A | Configuration B |
|---|---|---|
| In-sample net return | 28% | 24% |
| Maximum drawdown | 34% | 18% |
| Profit factor | 1.48 | 1.44 |
| Neighboring settings with positive net return | 12% | 71% |
| Out-of-sample net return | 2% | 7% |
Configuration A wins on historical return. But its sharp fall from 28% in sample to 2% out of sample is a classic symptom of fitting to noise. Configuration B is weaker on the optimized objective but stronger on drawdown, neighborhood stability, and the untouched period.
Which is “best” depends on the decision. But if the purpose is to identify a configuration that may survive beyond the test, A's first-place ranking is not decisive.
Use a hierarchy, not a metric soup
The solution is not to optimize ten metrics simultaneously until the output becomes impossible to interpret. It is to define a decision hierarchy:
- Minimum viability: Does the configuration remain positive after realistic costs?
- Risk boundary: Does it stay within an acceptable drawdown or exposure limit?
- Stability: Do neighboring settings behave similarly?
- Validation: Does the region retain useful behavior outside the optimization sample?
- Preference: Among configurations that pass, which best fits the strategy's intended objective?
This prevents a spectacular headline metric from compensating for evidence that should have disqualified the configuration earlier.
Test neighborhoods across multiple dimensions
One-dimensional charts are easy to understand, but most strategies contain interacting parameters.
A stop distance may look stable only for one entry threshold. A lookback may appear robust until paired with a different exit rule. A volatility filter may improve returns by removing difficult periods, while also reducing the trade count until the result depends on very little evidence.
For two parameters, a heatmap is often more informative than a ranked table. Each cell shows the result for one combination, allowing stable regions, cliffs, ridges, and isolated islands to become visible.
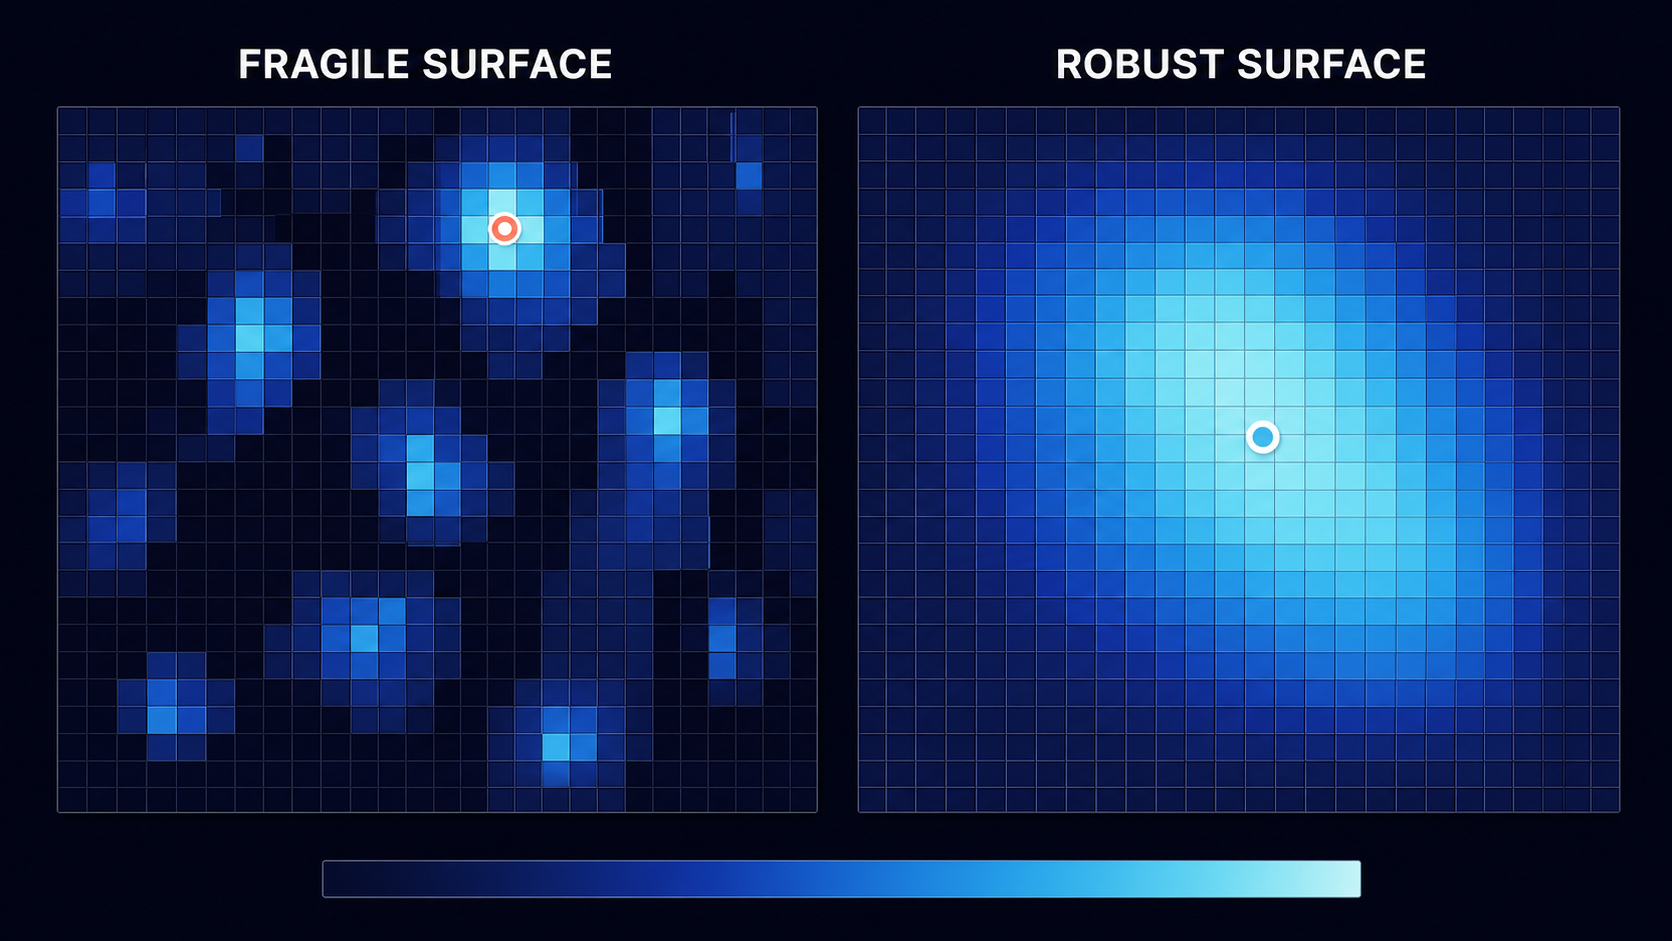
The robust selection sits inside the stable region, increasing its distance from the nearest failure boundary. The brightest historical cell is not automatically the best operational choice.
The earlier visual described broad diagnostic outcomes. On a two-parameter surface, those outcomes appear through four geometric patterns:
- Plateau: A contiguous region of similar outcomes. Potentially robust, subject to validation.
- Ridge: Several combinations work, but only when parameters move together. This may reflect a real relationship or hidden redundancy.
- Cliff: Small changes create large deterioration. Operationally fragile.
- Island: One small successful pocket surrounded by poor outcomes. High overfitting risk.
The center of a robust region may be a better operational choice than its highest cell. It leaves more room for the market or implementation to change before the strategy crosses into failure.
This is not a rule to select the geometric center mechanically. It is a reminder that distance from failure can matter more than distance from the historical maximum.
Separate selection from validation
Once you use a period to choose parameters, that period can no longer provide an unbiased assessment of the choice.
This is the central discipline of out-of-sample testing:
- In-sample data helps develop the rules and identify candidate regions.
- Validation data helps compare development choices without touching the final test.
- Out-of-sample data evaluates the locked process once.
The word locked matters. If the out-of-sample result disappoints and you return to adjust the parameters, the period has joined the training process. It may still be useful for development, but it is no longer untouched evidence.
Walk-forward testing extends this idea through time. Parameters are selected using only information available before each test window, then evaluated in the following period. The process repeats, producing a sequence of genuinely forward decisions within historical data.
Walk-forward testing is not immunity from overfitting. Window lengths, retraining frequency, objectives, and promotion rules are parameters too. If enough walk-forward designs are tried and only the best is reported, the selection problem has merely moved up one level.
The correct question remains:
How many decisions were influenced by the data now being presented as validation?
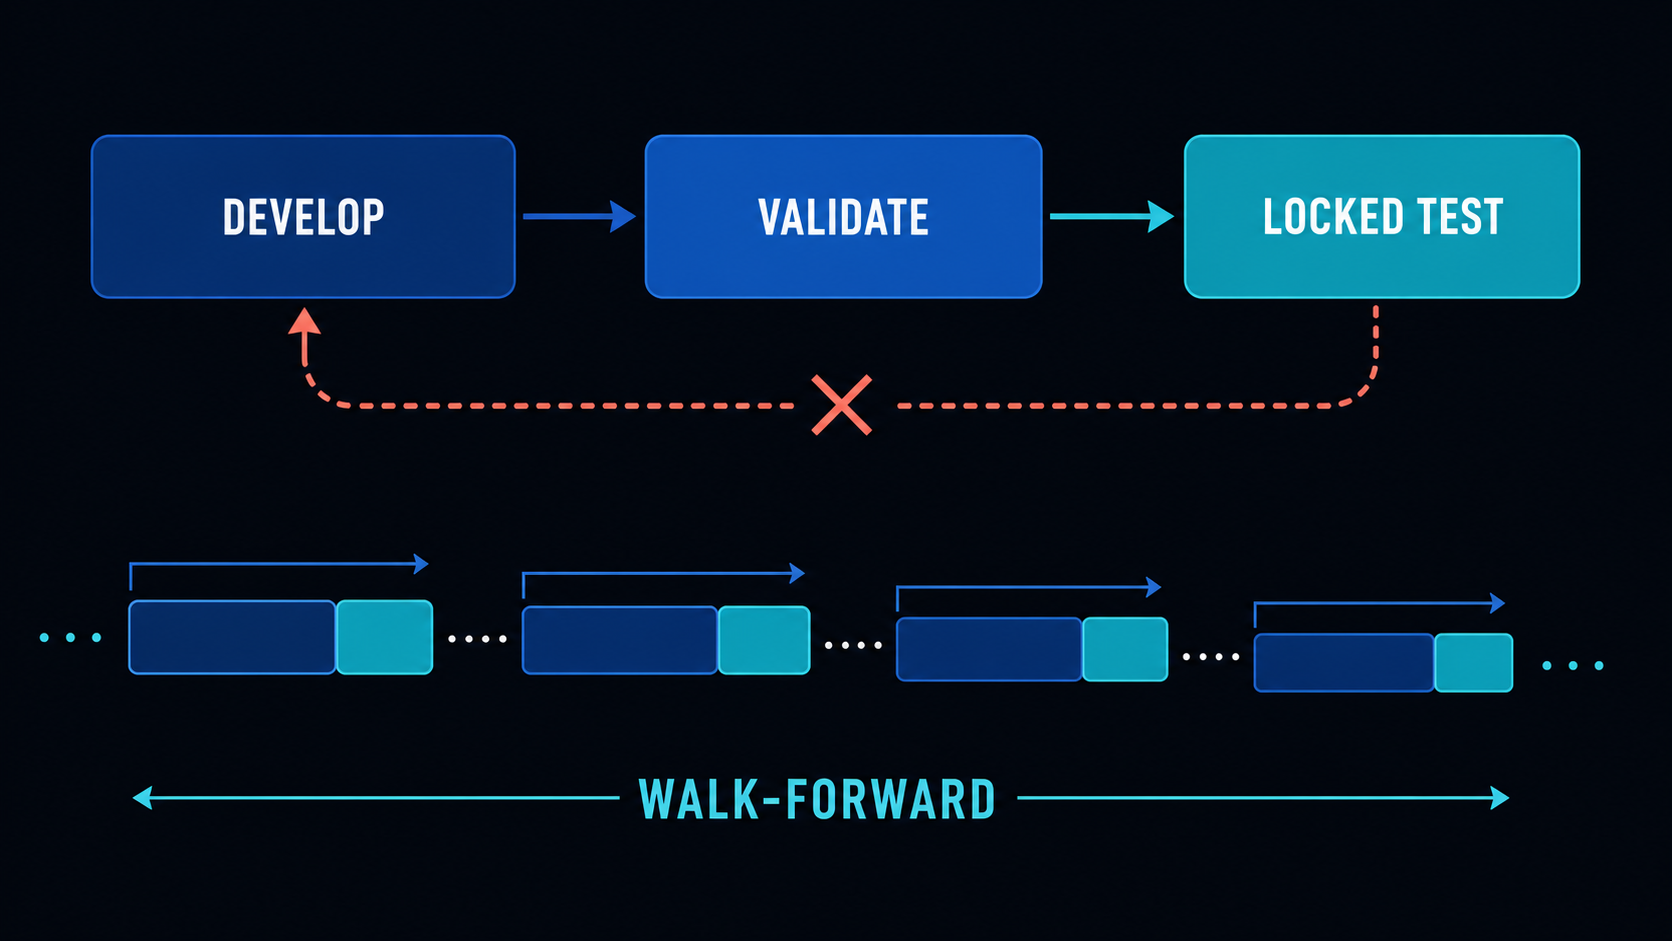
Once a test period changes a decision, it has become part of development. Walk-forward testing preserves the sequence: select first, then observe what happened next.
Ask whether the region survives a different market
A stable parameter range can still be conditional on one market regime.
Suppose lookbacks from 30 to 45 days perform well over the full sample. That looks reassuring until the period is divided:
- During persistent trends, the entire region is profitable.
- During range-bound markets, the same region is flat.
- During high-volatility reversals, most of it loses money.
The full-sample plateau was real, but incomplete. It averaged together three different behaviors.
This does not automatically invalidate the strategy. It changes the claim. The strategy may be useful when a particular condition is present and unsuitable when it is absent.
Robustness therefore has at least three dimensions:
- Parameter robustness: nearby settings behave similarly.
- Temporal robustness: the result persists across different periods.
- Conditional robustness: behavior is understood across relevant market states.
An instrument test adds a fourth. If the economic idea should travel, examine whether it appears elsewhere. If it should be instrument-specific, explain why.
The goal is not for every strategy to work everywhere. The goal is to prevent a conditional result from being described as universal.
Prefer the simplest defensible choice inside the robust region
After identifying and validating a robust region, one setting must still be selected for implementation.
This is where simplicity becomes useful.
If lookbacks from 31 to 46 days behave similarly, there may be little justification for choosing 37 because it produced the highest backtest profit. A rounder or operationally simpler value may be easier to explain, monitor, and maintain. If two filters contribute nearly identical results, the strategy with one fewer dependency may be easier to execute and less likely to fail for an unobserved reason.
Simplicity does not create an edge. It reduces the number of ways an apparent edge can depend on precision you do not possess.
Prefer, all else reasonably equal:
- fewer adjustable parameters;
- wider stable ranges;
- gradual degradation;
- lower turnover and implementation sensitivity;
- clearer economic rationale; and
- rules that can be stated before the next test is seen.
When several choices are supported by similar evidence, choose the one that asks the least of the future.
A practical robust-range workflow
The following process turns optimization from a winner-selection exercise into a structured investigation.
1. Define the hypothesis before the grid
State why the parameter should matter and define a plausible range. A search from 2 to 500 because the software permits it is not the same as testing values supported by the strategy's logic.
2. Record the search budget
Document the parameters, values, instruments, periods, objectives, and variations tested. The research trail matters because the final winner inherits the luck of the entire search.
3. Map the surface
Retain every tested result, not only the leaders. Inspect neighborhoods, interactions, cliffs, ridges, and islands using consistent scales.
4. Apply viability gates
Remove configurations that fail realistic costs, minimum trade counts, risk boundaries, liquidity constraints, or other requirements established before ranking.
5. Identify candidate regions
Look for contiguous areas with acceptable performance and gradual degradation. Do not select the final parameter yet.
6. Challenge the regions
Increase costs. Split regimes. Shift the time period. Test another instrument where appropriate. Examine whether the region persists or relocates completely.
7. Lock the process and test forward
Specify how a region produces an implementable choice, then evaluate that rule on untouched data. Do not repair the result after seeing it and continue calling the period out of sample.
8. Choose for resilience
Within the surviving region, favor a setting with operational margin, simplicity, and distance from known failure boundaries, not merely the highest historical cell.
9. Monitor the region, not just the chosen point
Live performance at one setting is noisy. Periodically examine whether the broader neighborhood still behaves as expected. If the entire region deteriorates, the issue may be the underlying logic rather than the chosen parameter.

Optimization becomes useful when it narrows a documented search into a resilient next test, not when it simply crowns the top historical row.
The Robust Parameter Scorecard
Use this scorecard to evaluate the evidence surrounding a proposed setting.
| Lens | Fragile evidence | Stronger evidence |
|---|---|---|
| Search | Only the winner is retained | Full search space and trial count documented |
| Shape | Isolated peak or island | Broad contiguous region |
| Decay | Small changes cause collapse | Performance degrades gradually |
| Objectives | Winner depends on one headline metric | Viability, risk, stability, and purpose agree |
| Costs | Region disappears under modest friction | Region survives conservative assumptions |
| Time | Selected and judged on the same period | Process survives locked later data |
| Regimes | Plateau comes from one favorable state | Conditional behavior is understood |
| Simplicity | Exact, complex setting required | Simpler choice works within the region |
This is not a mechanical pass/fail model. The lenses are not equally important for every strategy. A high-turnover strategy may place greater weight on cost stability. A trend-following strategy may reasonably depend on occasional outliers. A regime-specific strategy may not be expected to perform during every market state.
The scorecard's purpose is to make the evidence visible, and to stop “highest backtest result” from making the decision by default.
What a plateau does not prove
The plateau metaphor is useful, but it can be abused.
A broad flat region may indicate robustness. It may also indicate that the parameter barely matters because the strategy has little edge anywhere. A coarse grid can make a jagged surface look smooth. Highly correlated parameter combinations can create an apparent ridge without adding independent evidence. And a beautiful in-sample plateau can disappear completely out of sample.
So do not replace one shortcut (choose the peak) with another (choose any plateau).
A robust region becomes meaningful only when:
- its performance is economically useful, not merely less bad;
- the sample contains enough relevant observations;
- execution assumptions are credible;
- the region survives some form of untouched or forward validation;
- the behavior is understandable across important regimes; and
- the search process itself is disclosed.
Robustness reduces one kind of uncertainty. It does not remove uncertainty from trading.
📝 The Edge Note
Optimization is often presented as a search for the answer. A better use is to discover how dependent the strategy is on being exactly right.
If only one setting works, the strategy may be asking the future to reproduce the past with unreasonable precision.
If a broad range works, the conclusion is more modest but more useful: the underlying behavior may survive ordinary variation.
That is the difference between selecting a number and evaluating an idea.
Before accepting the next “optimal” configuration, ask:
- How many alternatives were tested before this one won?
- What happens immediately around it?
- Does it remain attractive after costs and risk are considered?
- Does the region persist in later data and different conditions?
- Would a simpler setting tell substantially the same story?
- What evidence would make us abandon the entire region, not merely choose a different point inside it?
The objective is not to find the setting that explains history most perfectly. It is to find a process that depends least on history repeating perfectly.
📚 References
- White, H. (2000). A Reality Check for Data Snooping. Econometrica, 68(5), 1097–1126. Introduces a test of whether the best model found in a specification search has genuine predictive superiority over a benchmark.
- Sullivan, R., Timmermann, A., & White, H. (1999). Data-Snooping, Technical Trading Rule Performance, and the Bootstrap. The Journal of Finance, 54(5), 1647–1691. Evaluates technical rules while accounting for the universe of alternatives from which a winner was selected.
- Hansen, P. R. (2005). A Test for Superior Predictive Ability. Journal of Business & Economic Statistics, 23(4), 365–380. Develops a test for comparing predictive models while addressing limitations of earlier data-snooping methods.
- Bailey, D. H., Borwein, J. M., López de Prado, M., & Zhu, Q. J. (2017). The Probability of Backtest Overfitting. Journal of Computational Finance, 20(4), 39–69. Proposes a framework for estimating whether the selected backtest is likely to underperform out of sample. DOI: 10.21314/JCF.2016.322.
- Bailey, D. H., & López de Prado, M. (2014). The Deflated Sharpe Ratio: Correcting for Selection Bias, Backtest Overfitting and Non-Normality. The Journal of Portfolio Management, 40(5), 94–107. Adjusts an observed Sharpe ratio for multiple testing and non-normal returns.
📖 Previously in the series
The Backtest Is Not the Strategy: Five Ways a Profitable Result Can Still Be Fragile
📖 Next in Insights
Same Code, Different Evidence: What Two MAIR Purchases Reveal
Where TradingEdgeIQ fits
The research process described here can be performed manually with a complete optimization export, careful recordkeeping, and disciplined validation.
TradingEdgeIQ's Strategy Optimizer applies the same principle: compare configurations, inspect robustness and sensitivity, and identify safer next tests without presenting one historical winner as a prediction. Full optimization, robustness, sensitivity, and stress-testing workflows are available on Premium; Pro may include a limited preview. The tooling can make comparison, visualization, and documentation more consistent. It cannot convert a backtest into certainty or make the final trading decision for the user.
Research and analytics only. No auto-trading. No financial advice. Historical and simulated results do not guarantee future performance.
Related