
The Backtest Is Not the Strategy: Five Ways a Profitable Result Can Still Be Fragile
A profitable backtest answers what happened under one test. It does not explain why it happened, or whether the edge survives contact with costs, different parameters, another market regime, or a different order of trades.
Anuj Saxena · Founder, TradingEdgeIQ
Download the PDFSecond in a series on structured trading research. Previously: From Trading Idea to Trading Decision, which set out a four-stage workflow: Discover, Analyze, Simulate, Decide. This article goes inside the Analyze stage. Next: The Best Parameter Is Often the Wrong Answer, on why robust ranges beat a single optimum.
A profitable backtest can still describe a weak strategy.
The headline result answers one question: what happened when these rules met this stretch of history. It does not, by itself, explain why it happened, or whether the edge is likely to survive anywhere else.
That gap is where most strategy disappointment is born. Not in bad arithmetic, but in a correct number carrying more weight than it can bear.
Backtests are indispensable. They convert a vague intuition into explicit rules and force those rules to meet evidence. The problem is not that backtests mislead. It is that the same profit curve can be produced by very different things: a durable mechanism, favorable luck, repeated searching, unrealistic fills, or a single agreeable market regime.
So the useful question is not "was it profitable?" It is:
What must be challenged before historical profitability is allowed to influence a live trading decision?
This article proposes five challenges. Each one is a way a profitable result can be fragile, and each has a diagnostic you can actually run.
The working hypothesis: a strategy becomes more credible when its performance survives reasonable changes to the data, the costs, the parameters, the market regime, and the path of returns.
⚠️ Fragility 1: Selection bias turns searching into apparent skill
If you test enough variations, some will look exceptional purely by chance.
This is the quietest of the five, because nothing about the winning result looks wrong. The winner simply inherits every rejected attempt that came before it, and those attempts are usually invisible by the time anyone sees the equity curve.
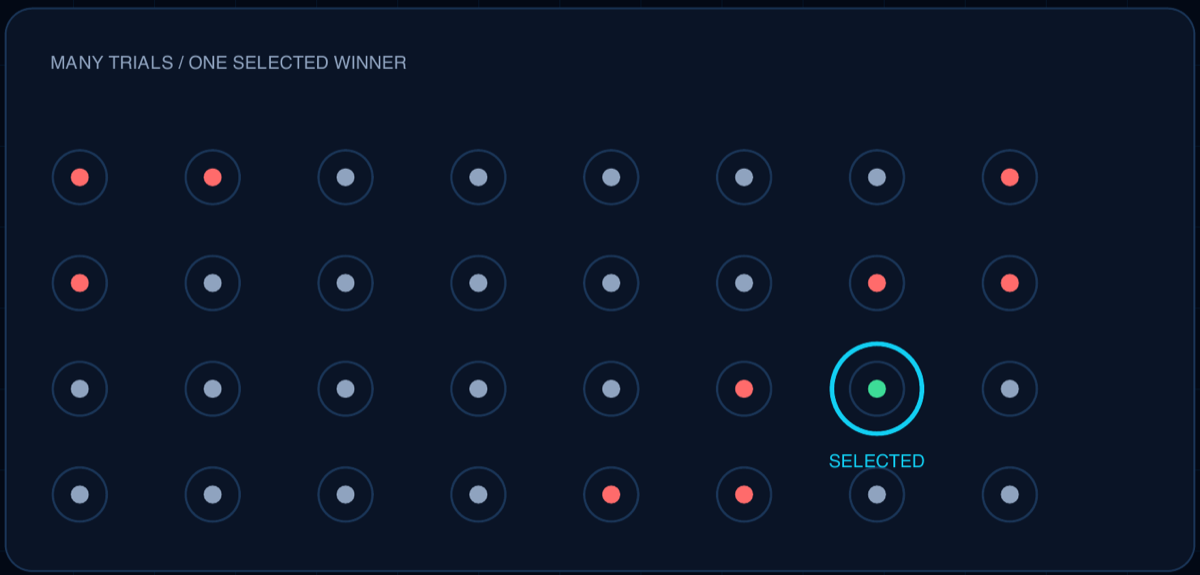
This is not a fringe concern. Campbell Harvey, Yan Liu and Heqing Zhu cataloged hundreds of published factors purporting to explain stock returns and argued that, once you account for how many hypotheses have been tried across the literature, the conventional significance threshold is far too lenient. They propose a t-statistic closer to 3.0 rather than the customary 2.0 before a new "discovery" should be believed. Harvey and Liu extended the same logic directly to backtesting, proposing that reported Sharpe ratios be explicitly haircut to reflect the number of trials behind them.
David Bailey, Jonathan Borwein, Marcos López de Prado and Qiji Jim Zhu put the point more bluntly in the Notices of the American Mathematical Society, arguing that backtest overfitting is pervasive enough that a great many published strategy results should be treated as unreliable, and that simply holding out a test set does not rescue you if you keep returning to it.
What creates the illusion: trying many instruments, date ranges, indicators, exit rules and parameter combinations, then reporting only the best outcome.
What stronger evidence looks like: a hypothesis written down before testing, a deliberately limited search space, validation data that was never touched during development, and honest disclosure of how many alternatives were tried.
Diagnostic question: Would this result still look persuasive if every failed experiment were shown beside the winner?
If the answer is no, the number on the screen is partly a measure of how long you searched.
⚠️ Fragility 2: Execution friction erases edges that exist only on paper
Commissions are visible and easy to model. Slippage, spread, latency, partial fills and market impact are less visible, and considerably more dangerous.
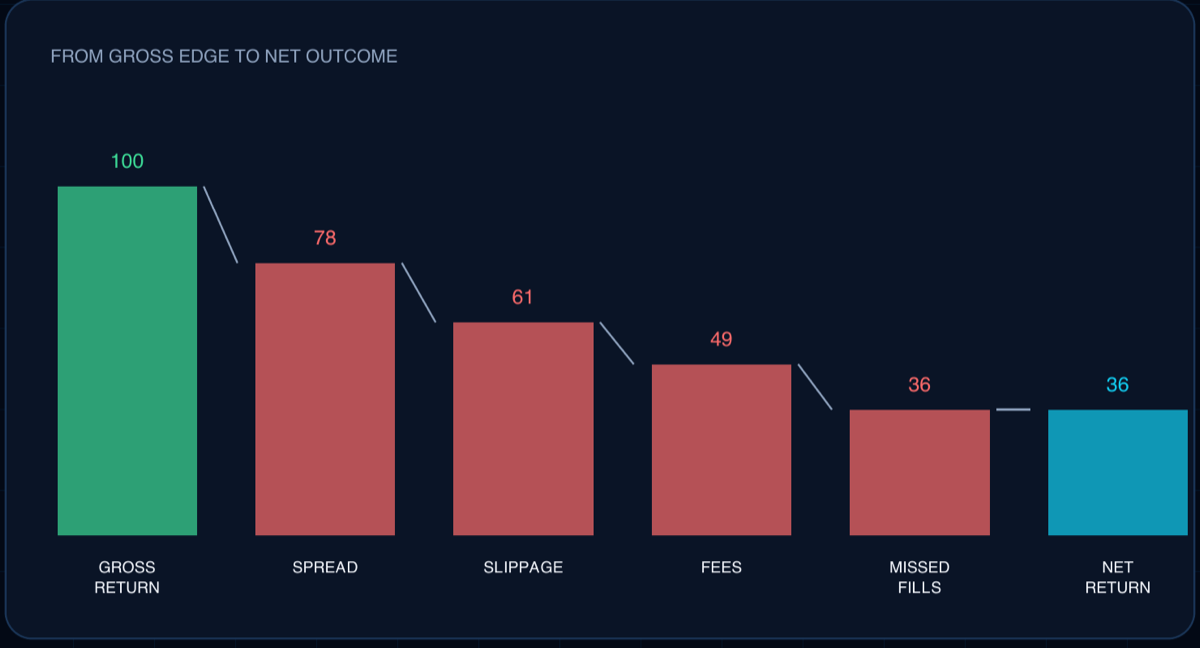
A small per-trade distortion becomes material when turnover is high, or when the average trade has little room to absorb error. A strategy earning a few basis points per trade can be entirely consumed by the difference between the fill you modeled and the fill you get.
The academic record is unkind here too. Robert Novy-Marx and Mihail Velikov examined a broad set of documented anomalies and found that once realistic trading costs are applied, many of them deliver substantially reduced profits, and a number of the higher-turnover ones cease to be profitable at all. The edge did not vanish because the signal was wrong. It vanished because it was never large enough to pay for its own execution.
Stress the assumptions rather than confirm them:
- Double your estimated slippage.
- Widen the spread.
- Delay entry and exit by a bar.
- Remove the most favorable fills entirely.
Then look for economic margin. A credible edge should remain useful under conservative implementation costs, not optimistic ones.
If modest friction turns profit into loss, the strategy may be measuring execution fantasy rather than market opportunity.
⚠️ Fragility 3: A robust strategy lives on a plateau, not a peak
The best parameter is often the least trustworthy answer.
When a setting produces a spectacular result and its immediate neighbors deteriorate sharply, that is not evidence of precision. It is usually evidence that the parameter has been fitted to noise that will not repeat.
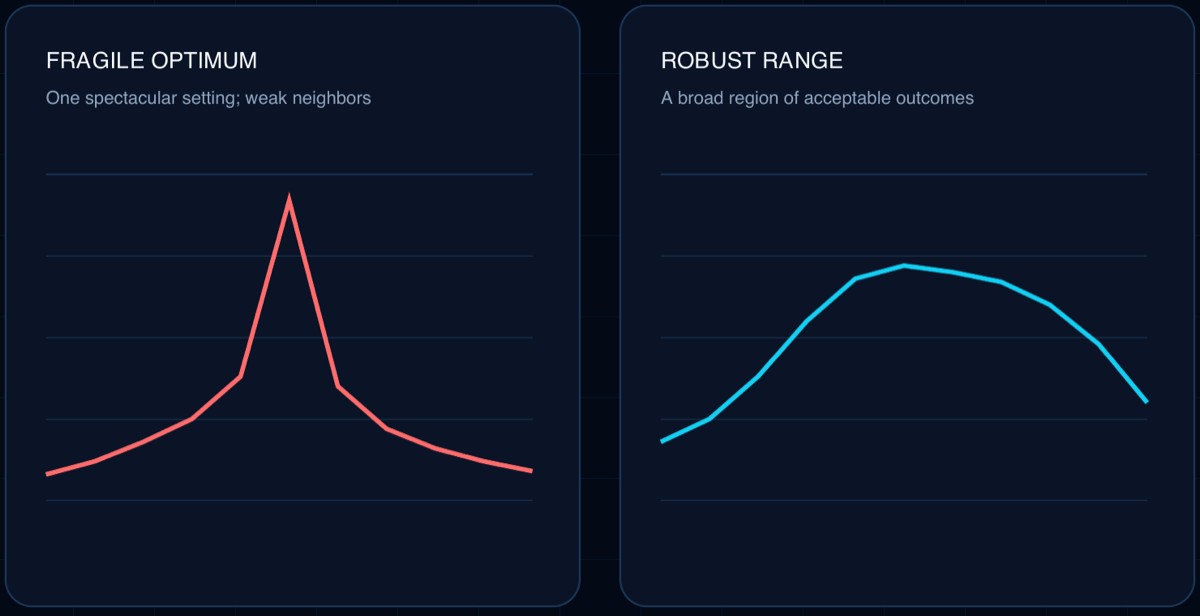
A strategy whose performance degrades gracefully across a broad, stable neighborhood of settings is telling you something structural. A single narrow spike is telling you something about the past.
The practical sequence:
- Map the nearby parameter values, not just the winner.
- Prefer stable regions over isolated maxima.
- Re-test the stable region after costs and regime splits.
- When results are similar, choose operational simplicity.
The objective is not to prove one setting was optimal in the past. It is to establish whether the logic remains useful across a reasonable range of choices.
A sharp optimum invites a difficult question: did the strategy discover structure, or memorize noise?
⚠️ Fragility 4: One market regime cannot validate behavior in another
Trend, volatility, liquidity and correlation structures all change. A backtest concentrated in one favorable environment can be historically accurate and operationally misleading at the same time.
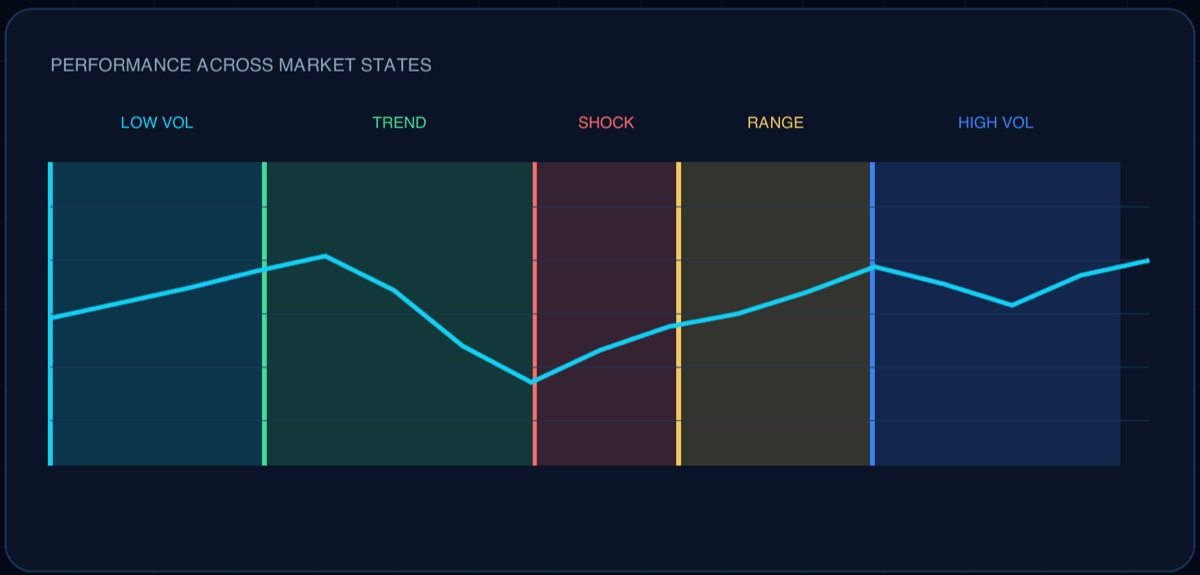
This is not a flaw in the test. It is a limit on what the test is entitled to claim.
Four splits, each answering a different question:
- Time split. Train on an earlier period; validate on a later one without re-tuning. The re-tuning is what quietly destroys the evidence.
- Regime split. Compare behavior across trending, ranging, high-volatility and low-volatility periods.
- Instrument split. Test whether the logic travels, or whether it depends on the idiosyncrasies of one market.
- Walk-forward. Repeat the process using only information that was available at each point in time.
A strategy that only works in one state is not necessarily a bad strategy. But it is a conditional one, and it should be deployed with that condition made explicit, including how you would recognize the condition ending.
⚠️ Fragility 5: The path of returns can matter more than the total
Two backtests can finish at exactly the same profit while subjecting a trader to radically different experiences along the way.
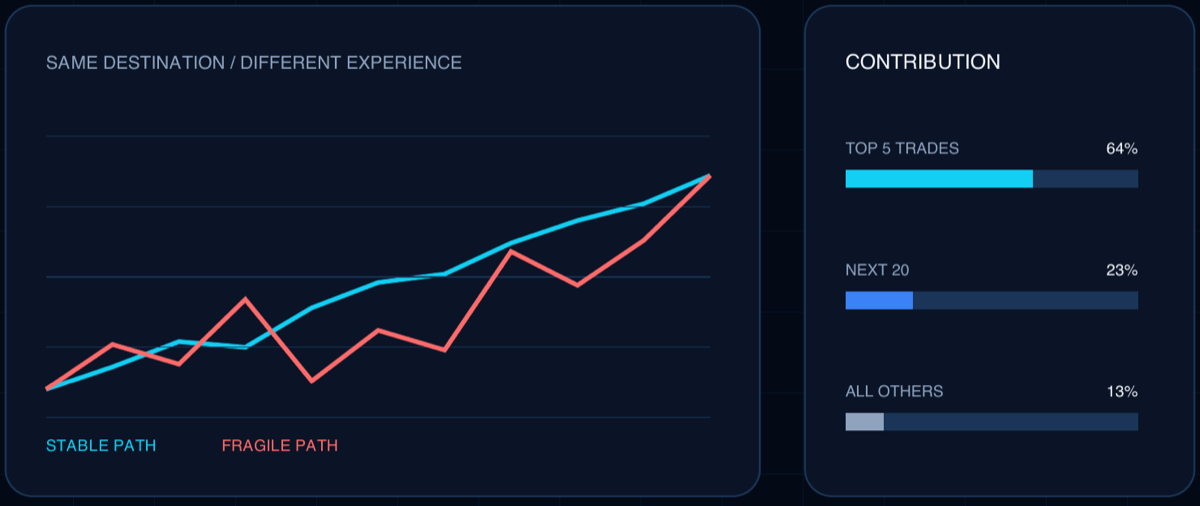
Final equity says nothing about the depth of drawdowns, how long they lasted, how much of the profit came from a handful of trades, or whether the worst sequence would have arrived before the account had built any cushion.
A strategy can be profitable and still be impractical if its drawdown exceeds the trader's capital, mandate, or tolerance before the edge has time to recover.
What to examine beyond the total:
- Maximum and average drawdown
- Time under water
- Worst trade, and worst sequence of trades
- Share of total profit contributed by the best few trades
- Exposure during gaps and shocks
- Capacity and liquidity constraints
Concentration deserves particular attention. If a small number of trades produce the majority of the profit, the strategy's expectancy rests on rare events, and your sample of rare events is, by definition, small.
The final equity value is a destination. Risk is the terrain required to reach it.
🧭 The Backtest Resilience Scorecard
Use this to decide what the evidence permits, not what the headline profit encourages you to believe.
| Lens | Fragile signal | Stronger signal |
|---|---|---|
| 1. Selection | Winner chosen after broad searching | Hypothesis and search space documented |
| 2. Friction | Profit disappears under small costs | Positive margin under conservative costs |
| 3. Parameters | One narrow optimum | Broad stable neighborhood |
| 4. Regimes | Performance concentrated in one state | Useful across multiple relevant states |
| 5. Path | Deep drawdown or few trades dominate | Risk and contribution are diversified |
Interpreting the count of strong lenses:
- 0–1: treat as a research result only.
- 2–3: revise and re-test before going further.
- 4: a limited pilot may be reasonable, with explicit risk controls.
- 5: a stronger candidate for forward testing. Still not proof of future performance.
A backtest earns confidence by surviving attempts to disprove it.
📝 The Edge Note
A backtest is not a certificate of truth. It is a structured claim about how a set of rules interacted with one historical record.
The purpose of validation is not to make uncertainty disappear. It is to discover whether the strategy still deserves attention after its most convenient assumptions are removed.
Four questions worth carrying into your next review:
- Which single assumption contributes most to the strategy's apparent edge?
- What evidence would cause you to reject it?
- Would you still deploy it if the best historical period never returned?
- Are you optimizing for the highest result, or the most survivable process?
The last one is the difference between a number you can show someone and a process you can keep running.
📚 References
- Harvey, C. R., Liu, Y., & Zhu, H. (2016). …and the Cross-Section of Expected Returns. Review of Financial Studies, 29(1), 5–68., On multiple testing across the factor literature, and why a higher significance bar is warranted.
- Harvey, C. R., & Liu, Y. (2015). Backtesting. The Journal of Portfolio Management, 42(1), 13–28., Applies the multiple-testing correction directly to reported Sharpe ratios.
- Bailey, D. H., Borwein, J. M., López de Prado, M., & Zhu, Q. J. (2014). Pseudo-Mathematics and Financial Charlatanism: The Effects of Backtest Overfitting on Out-of-Sample Performance. Notices of the American Mathematical Society, 61(5), 458–471.
- Bailey, D. H., & López de Prado, M. (2014). The Deflated Sharpe Ratio: Correcting for Selection Bias, Backtest Overfitting and Non-Normality. The Journal of Portfolio Management, 40(5), 94–107.
- Novy-Marx, R., & Velikov, M. (2016). A Taxonomy of Anomalies and Their Trading Costs. Review of Financial Studies, 29(1), 104–147., On how much of a documented anomaly survives realistic execution costs.
📥 The companion report
The full Backtest Fragility Report covers all five lenses with the diagrams, the friction waterfall, the fragile-versus-robust parameter curves, the regime map, and the return-path comparison, plus the scorecard as a one-page reference.
📖 Previously in the series
From Trading Idea to Trading Decision: A More Structured Research Workflow
📖 Next in the series
The Best Parameter Is Often the Wrong Answer: Why Robust Ranges Matter More Than a Single Optimum
TradingEdgeIQ is a trading research and decision-support platform for self-directed traders. It is intended for research and education and does not provide personalized investment advice or guarantee trading results.
Learn more at tradingedgeiq.com.
Research and analytics only. No auto-trading. No financial advice. Historical and simulated results do not guarantee future performance.
Related