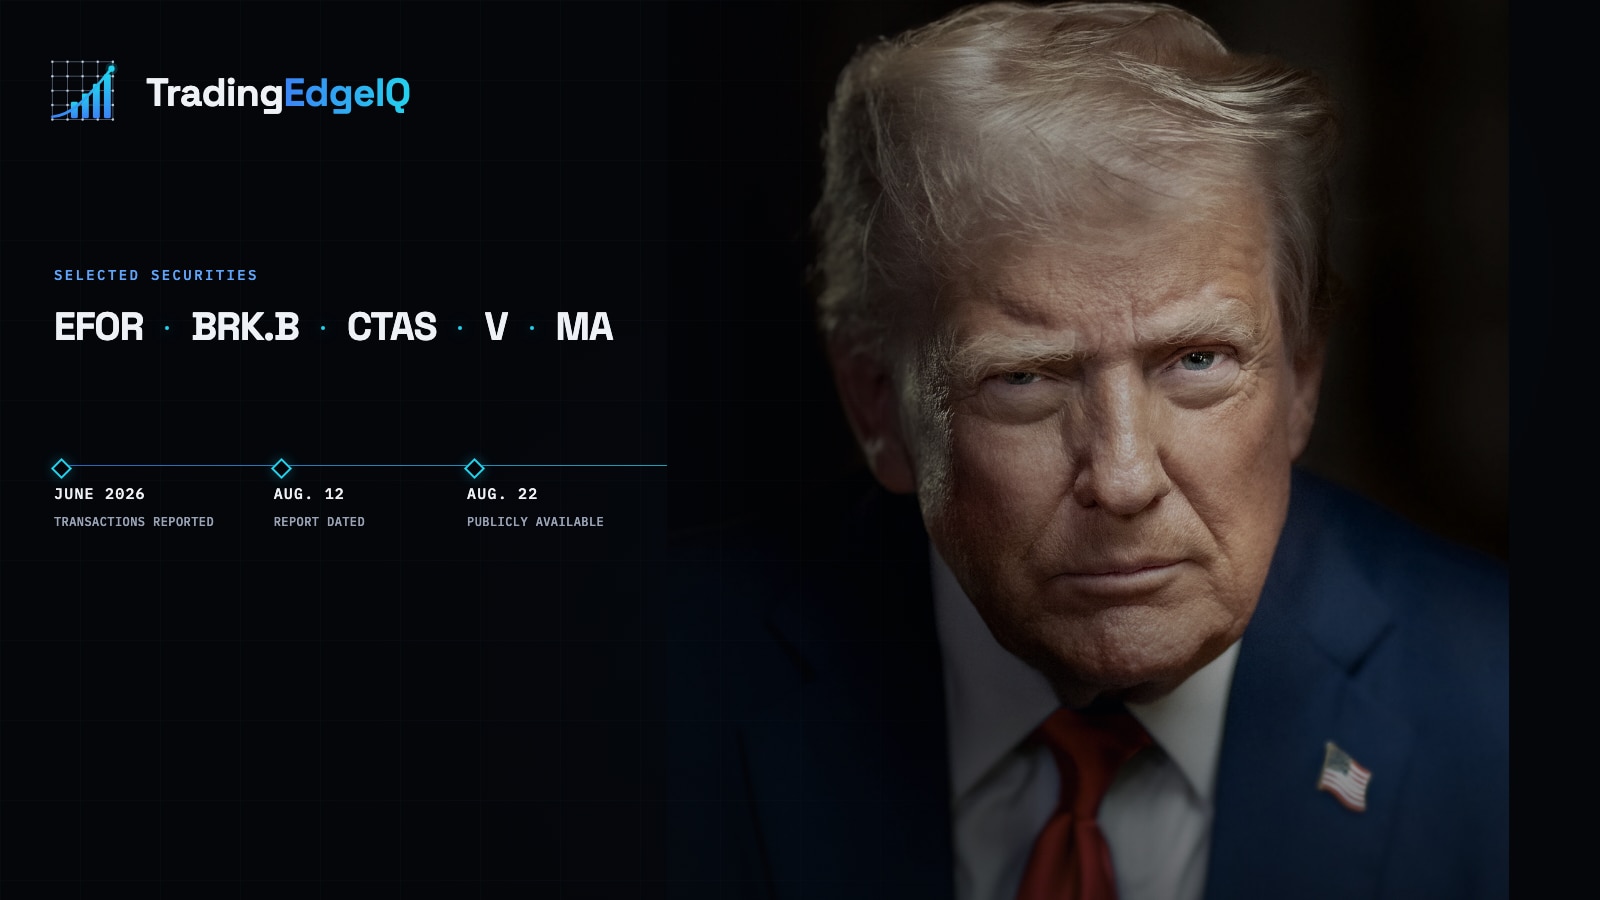
Donald Trump Disclosed 1,051 Trades. Which Ones Mattered?
A large presidential disclosure made headlines for its size. The more useful lesson came from separating ranges, directions, evidence, and the dates when each fact became public.
Anuj Saxena · Founder, TradingEdgeIQ
Previously in Insights: Same Code, Different Evidence: What Two MAIR Purchases Reveal
Next in the reading path: The AI Bet Nancy Pelosi Disclosed
The disclosure was large enough to become a headline. Its most useful lesson was about evidence and timing.
On August 22, 2026, major financial outlets began reporting a broad reshuffle in President Donald Trump's investment accounts. The underlying periodic transaction report contained 1,051 transactions involving stocks, bonds, and funds. Published estimates placed the disclosed aggregate activity between $78.1 million and $263.1 million.
That scale made one question irresistible: What did he buy?
A more useful question was: What could an investor actually know when the information became public?
The answer changed the story. The report was a mixed ledger, the values were disclosed as ranges, and the June transactions did not become publicly visible until late August. Several stocks later showed strong charts, but those charts could not turn a delayed disclosure into a timely entry signal.
This case study explains how to convert a famous disclosure into a disciplined research queue without inventing precision, intent, or tradable foresight.
The situation: 1,051 transactions attracted attention
The disclosure included purchases in widely followed companies such as Berkshire Hathaway, Cintas, Visa, and Mastercard. It also contained sales and additional activity across many securities and fixed-income instruments.
Selected purchase records included:
- Berkshire Hathaway (BRK.B)
- Cintas (CTAS)
- Visa (V)
- Mastercard (MA)
These names were naturally interesting. The charts for BRK.B, CTAS, V, and MA later looked constructive over the spring and summer. But the filing did not become public during the earlier parts of those moves. A later chart can describe market context. It cannot recreate information that investors did not yet have.
The disclosure also did not represent one simple bullish allocation. Some companies appeared in both purchase and sale records. The complete ledger therefore required record-level review rather than a single directional label.
The complication: the headline compressed three different problems
1. The values were ranges, not exact amounts
The disclosure form reports transaction values in bands. That is why public estimates ranged from $78.1 million to $263.1 million. The lower figure was the sum of reported lower bounds. The higher figure was the sum of reported upper bounds. Neither figure should be presented as a precise cash total.
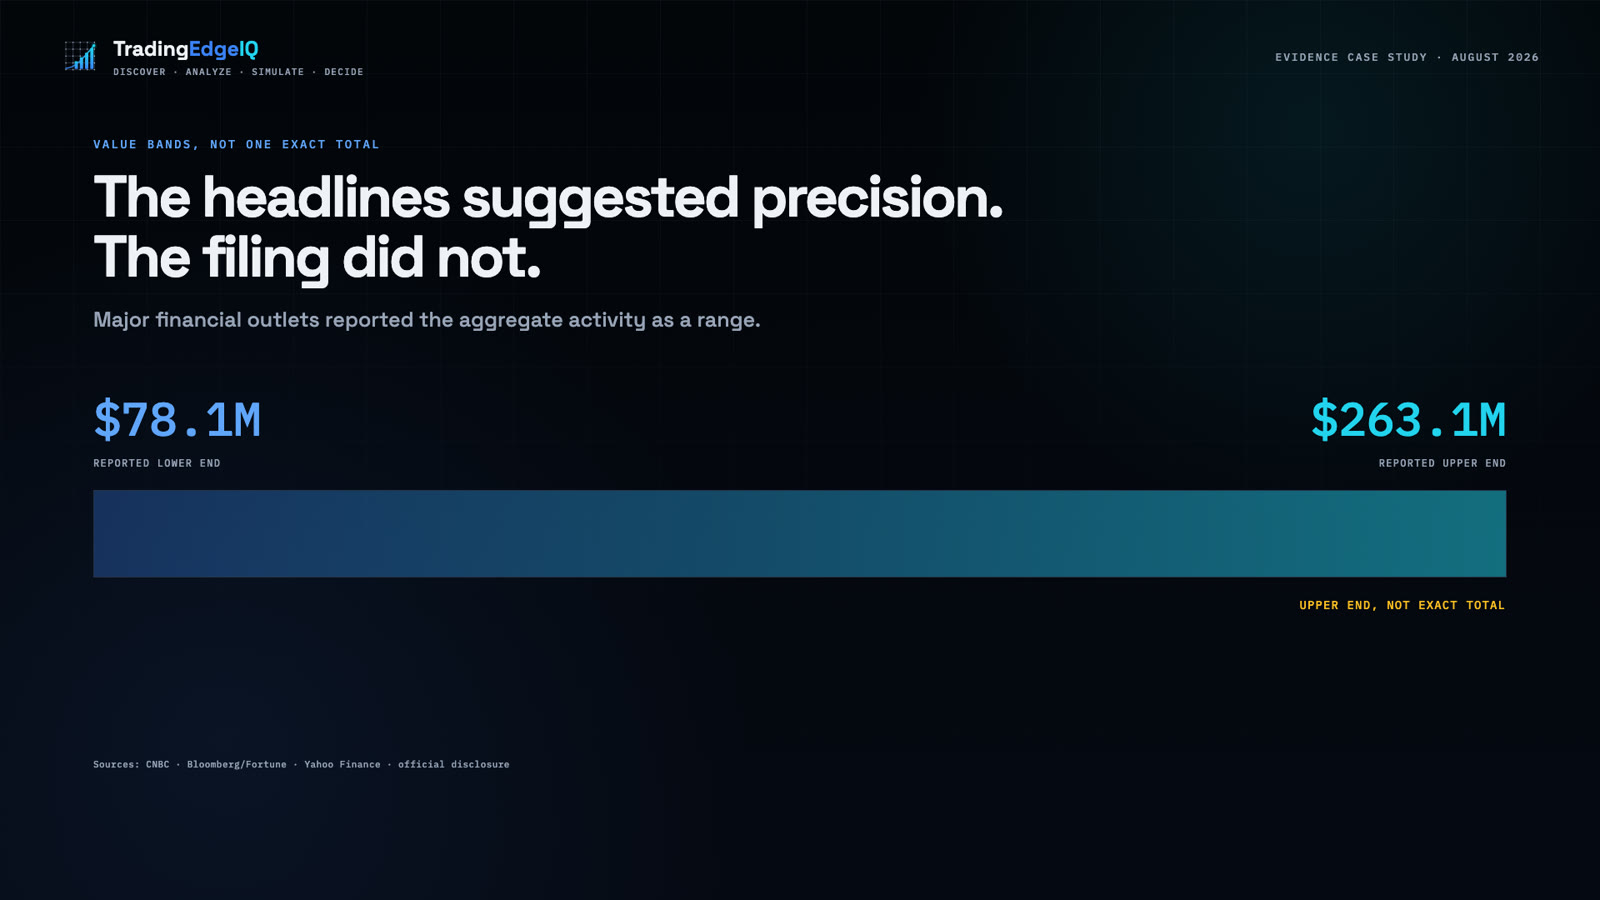
Ranges preserve what the filer reported. Replacing them with invented point estimates would create false precision.
2. The ledger mixed purchases and sales
Large counts can look like conviction when direction is ignored. Here, purchases, sales, stocks, bonds, and funds appeared together. A useful first pass had to separate transaction direction, group repeated activity by security, and retain the disclosed value bands.
The right output was not a list of supposed recommendations. It was a smaller list of records that deserved follow-up research.
3. The public clock started well after the transaction clock
The transactions occurred in June. The report was signed on August 12, received on August 13, certified on August 20, and widely reported beginning on August 22.
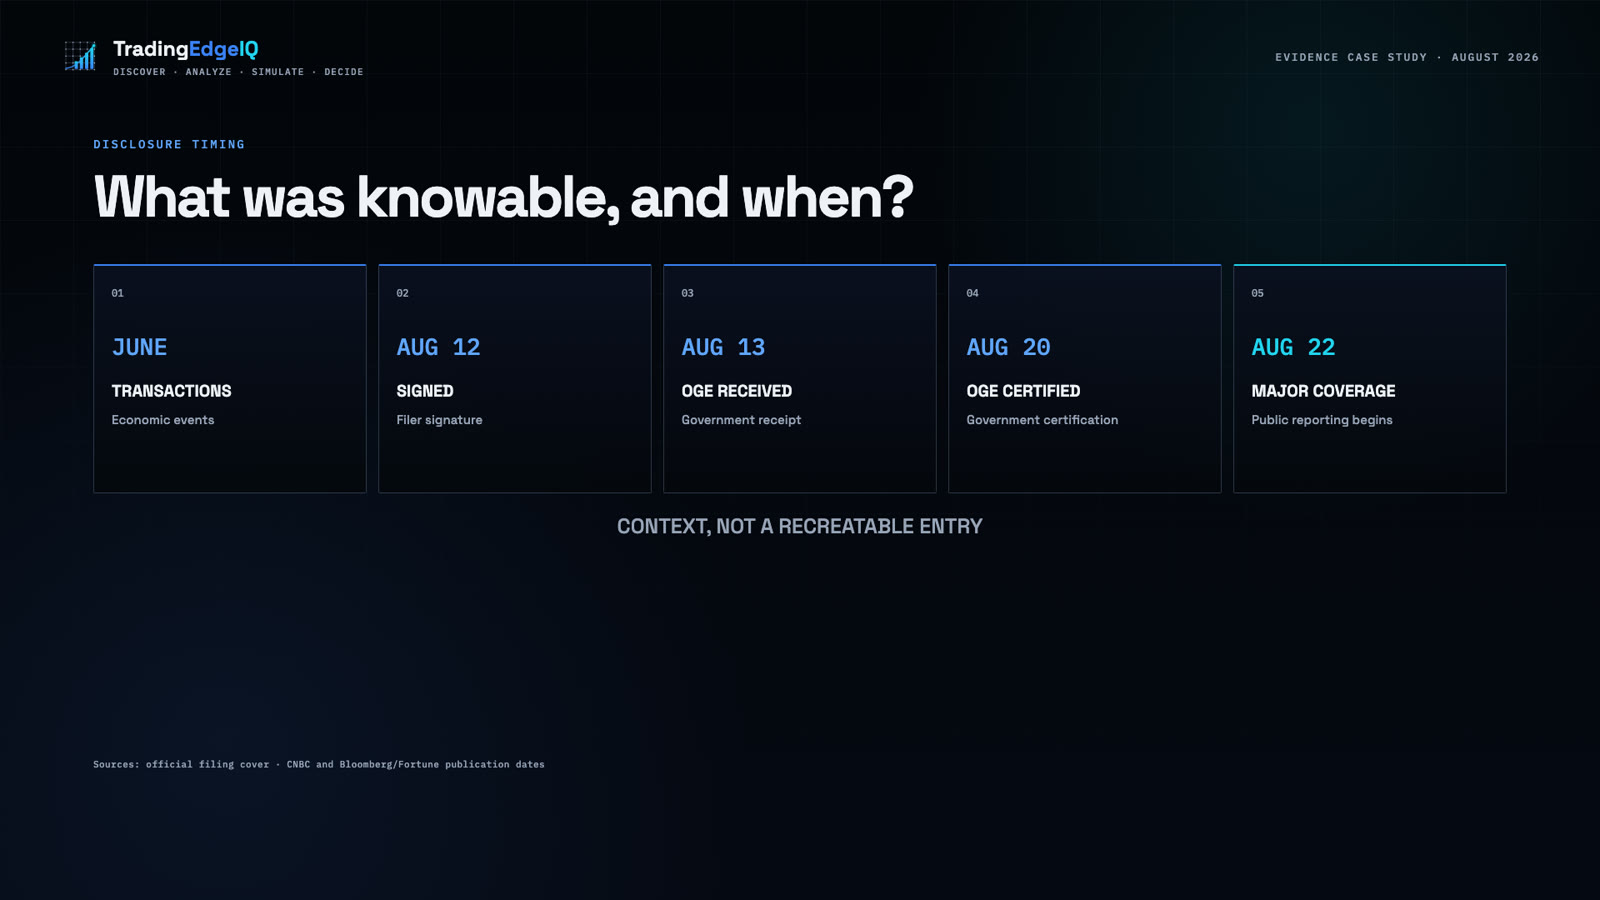
Those dates were not administrative trivia. They defined what an outside investor could know and when. Collapsing them into one date would make hindsight look like insight.
The question: which records deserved deeper research?
Size alone was a poor filter. Famous names generated attention, but attention was not the same as research priority.
A smaller Everforth purchase showed why.
The report disclosed an Everforth (EFOR) purchase on June 4 in a value range of $15,001 to $50,000. On July 28, Everforth separately announced a three-year $115 million U.S. Army artificial-intelligence research and engineering contract supporting the Army Research Laboratory's Nautilus program.
That chronology was not evidence of foreknowledge. It did not establish causation, explain the purchaser's intent, or validate the later price move. The company announcement was independent public evidence that made a relatively modest transaction more worthy of research after the disclosure became available.
Everforth was one example of the method, not the conclusion of the story.
The broader principle was evidence convergence. A transaction earned more research attention when separate sources added relevant company context and when the timing of every source remained explicit.
The resolution: turn the filing into a research queue
A disciplined workflow can reduce 1,051 records without pretending that the filing predicted prices.
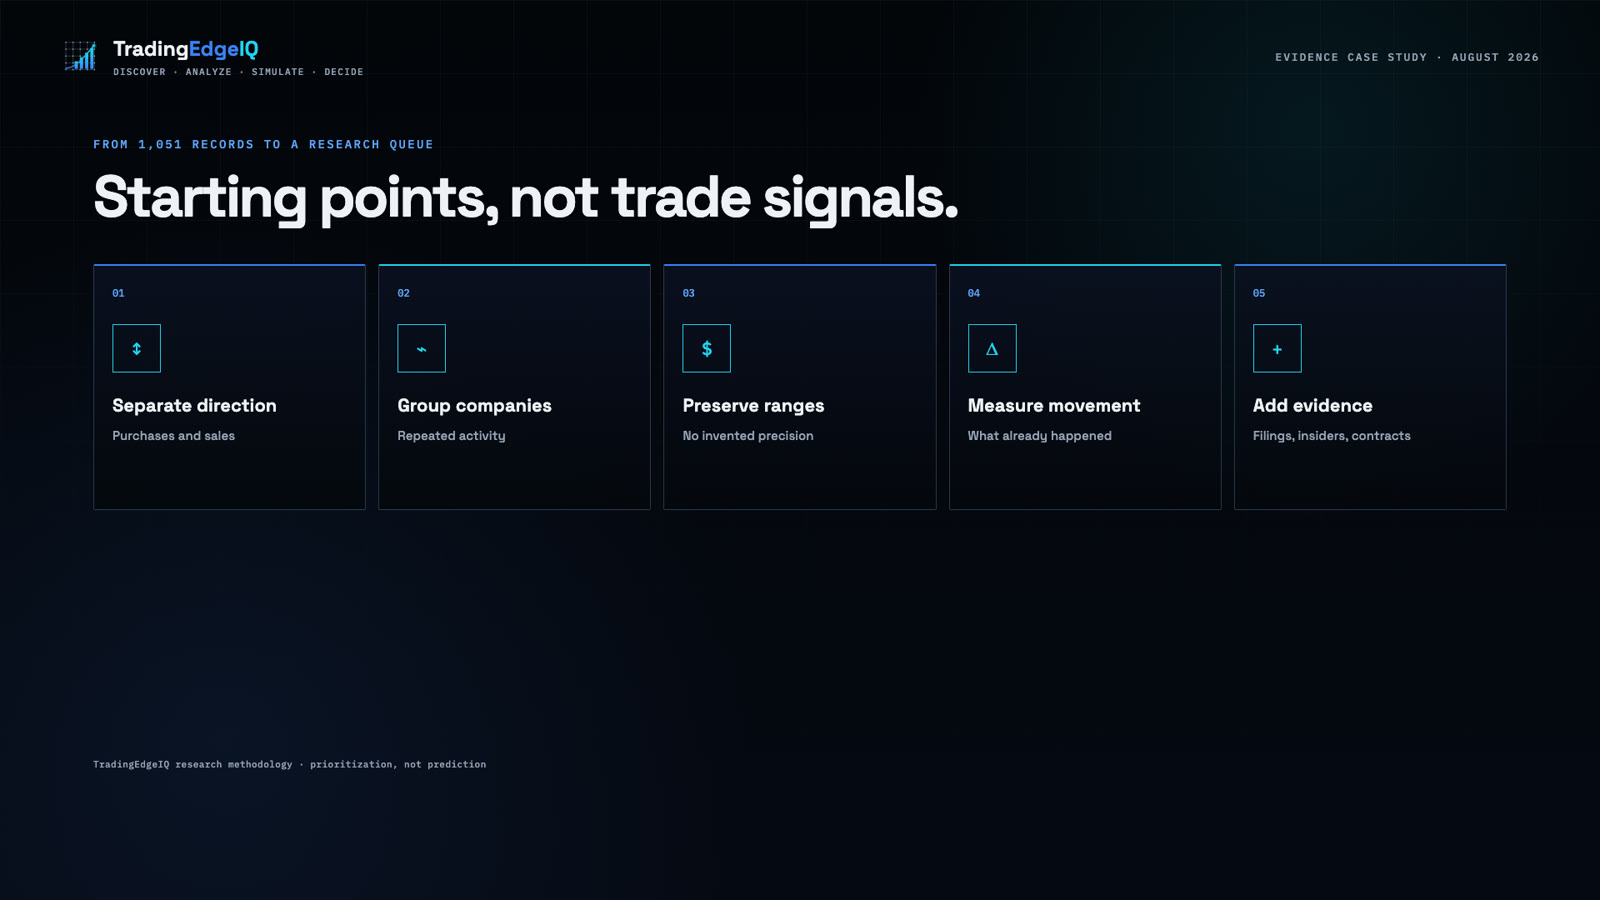
1. Separate purchases from sales
Direction comes before interpretation. A mixed ledger should never be summarized as one bullish or bearish bet.
2. Group repeated activity by company
Repeated purchases and sales can reveal allocation changes that disappear when each row is viewed alone.
3. Preserve every disclosed range
Use lower and upper bounds. Do not manufacture an exact total the source did not provide.
4. Measure what had already happened
Compare transaction dates, filing dates, public-reporting dates, and subsequent price movement. This prevents a retrospective chart from being mistaken for a contemporaneous opportunity.
5. Add independent evidence
Review company announcements, government contracts, insider filings, other public disclosures, and relevant market context. Record what each source establishes and what it does not.
This process did not produce a buy list. It produced better research questions.
What this case study revealed
The $263.1 million figure attracted attention because it was large. It was still only the upper end of reported value ranges.
The famous tickers generated interest because their later charts looked compelling. Those charts were retrospective because the underlying June transactions became public in late August.
Everforth stood out because a separate company disclosure added material context to a smaller record. The timing still did not prove intent, causation, or foreknowledge.
The durable lesson was simple: size attracts attention, fame creates headlines, and converging evidence creates a research priority.
The advantage was not copying a public figure's trades after the fact. It was using public evidence to decide what deserved attention next.
This analysis is a research and education case study, not a trade recommendation. It does not claim that any disclosed transaction was predictive or that any security should be bought or sold.
Sources
- White House public financial disclosures
- U.S. Office of Government Ethics guide to periodic transaction reports
- CNBC: Trump reshuffled his portfolio in June
- Yahoo Finance coverage of the June stock disclosure
- Everforth: $115 million Army AI research and engineering contract
📖 Previous in Insights
Same Code, Different Evidence: What Two MAIR Purchases Reveal
📖 Next in the reading path
The AI Bet Nancy Pelosi Disclosed
TradingEdgeIQ is a research and decision-support platform. This case study uses public disclosures and independent public sources for research and education. It does not provide personalized investment advice or recommend buying or selling any security.
Research and analytics only. No auto-trading. No financial advice. Historical and simulated results do not guarantee future performance.
Related