
Is Your Trading Strategy Profitable on Paper, but Fragile in Reality?
A profitable backtest can still hide unreliable data, concentrated gains, painful drawdowns, or assumptions that fail under scrutiny.
Anuj Saxena · Founder, TradingEdgeIQ
A profit curve tells you what happened in one historical test. It does not tell you why the result occurred or whether the process is durable.
Watch the video above, or read the evidence and reasoning below.
In the current collection, this article follows Berkshire's Lennar accumulation and leads to Nayax's two-founder purchases. Both filing research and strategy research improve when the underlying evidence is connected before a decision is made.
Previously, That "Big Fund Buy" May Be 45 Days Old showed why historical position data should not be mistaken for a current trade. This article turns to historical strategy results. Next, Can a Profitable Trading Strategy Still Fail a Prop-Firm Challenge? tests the strategy against account rules and path-dependent risk.
Situation: backtests summarize historical performance
A backtest can reveal net profit, win rate, drawdown, expectancy, profit factor, and other useful metrics. It is an essential tool for strategy research.
Complication: a profitable result can be fragile
The trade data may be incomplete. Costs may be understated. A few trades may contribute most of the profit. Drawdowns may be too severe for the trader to follow the system. A strong full-period result can also hide deterioration in recent data.
Question: what evidence supports the result?
1. Audit the trade data
Check date coverage, missing fields, duplicates, commission assumptions, and whether the data reflects the strategy that would actually be traded.
2. Connect the metrics
Profit factor, win rate, expectancy, average win and loss, trade count, and return concentration should tell a coherent story. No single metric deserves complete trust.
3. Examine the path
Review drawdown depth, duration, losing streaks, recovery time, and recent behavior. The path determines whether the strategy is financially and psychologically executable.
4. Decide the next test
Classify the evidence as strong, fragile, incomplete, or risky. Then document what should be validated next.
Resolution: turn a trade log into a reviewable decision
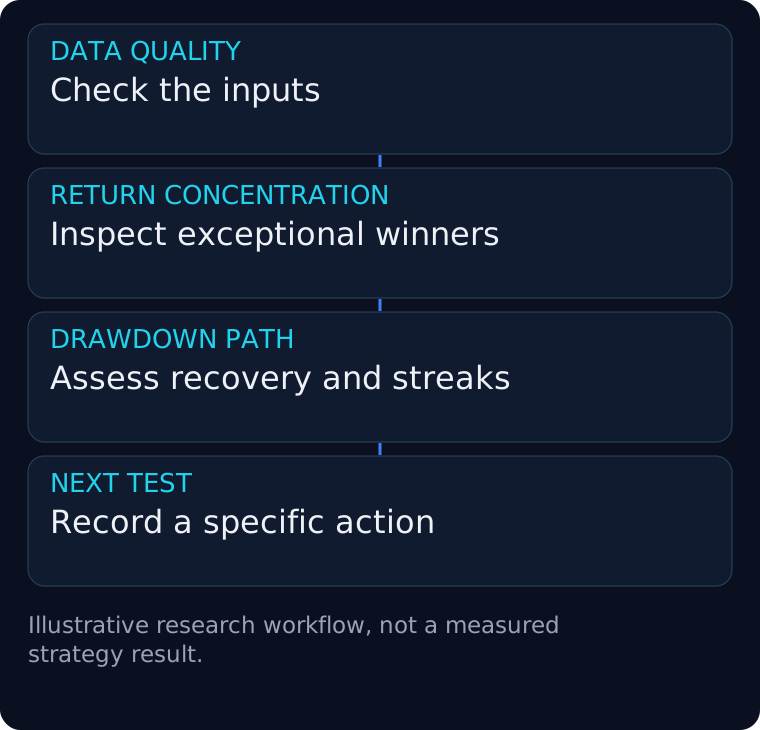
Consider a hypothetical trade log in which a handful of unusually large winners creates most of the net profit. The headline result looks attractive, but the decision depends on whether those trades represent a repeatable setup or circumstances the trader cannot expect to reproduce.
Compare their contribution with the rest of the sample. Check how much history the sample covers and whether costs were modeled consistently. Examine what happened between the winners, including recovery periods and losing streaks. The same final profit can conceal very different demands on capital and execution.
Then record the next test. A concentrated result may need more observations of the relevant setup. A cost-sensitive result may need realistic execution assumptions. Recent deterioration may justify pausing the deployment decision until another time segment is examined. Each finding should lead to a specific action, so analysis becomes useful instead of ending with another score.
Strategy Analyzer organizes performance, risk, data quality, robustness, caveats, and next actions into one research workflow. It does not guarantee future performance. It helps the trader understand which conclusion the evidence can support.
What this proved
Profitability is one result. Strategy quality depends on the data, distribution of returns, drawdown path, assumptions, and ability to survive further testing.
For a longer treatment of the same question, including selection bias, execution friction, parameter stability and market regimes, read The Backtest Is Not the Strategy: Five Ways a Profitable Result Can Still Be Fragile.
Return to That "Big Fund Buy" May Be 45 Days Old for the previous article. Continue to Can a Profitable Trading Strategy Still Fail a Prop-Firm Challenge? to see why a profitable strategy may still be incompatible with a specific evaluation.
Sources
The current collection continues from Berkshire's Lennar accumulation to Nayax's two-founder purchases. The shared question is whether an attractive observation holds up when its surrounding evidence is visible.
Cover: text-free conceptual artwork. The curves are illustrative, not a customer result or a chart of a named strategy.
Previous: That "Big Fund Buy" May Be 45 Days Old.
Next: Can a Profitable Trading Strategy Still Fail a Prop-Firm Challenge?.
Research and analytics only. No auto-trading. No financial advice. Historical and simulated results do not guarantee future performance.
Related